
Use Analytics to move from organization-wide activity to a group, course, or learner. The screenshots show the fictional Northstar demo workspace.
1. Review monthly learning activity
- Open Analytics from the workspace navigation.
- Locate Monthly activity.
- Choose the Reporting month. The current month is labeled Month to date.
- Compare Started and Completed for Learner MAU and Courses.
- Use the information buttons beside a metric to read its definition before comparing numbers.
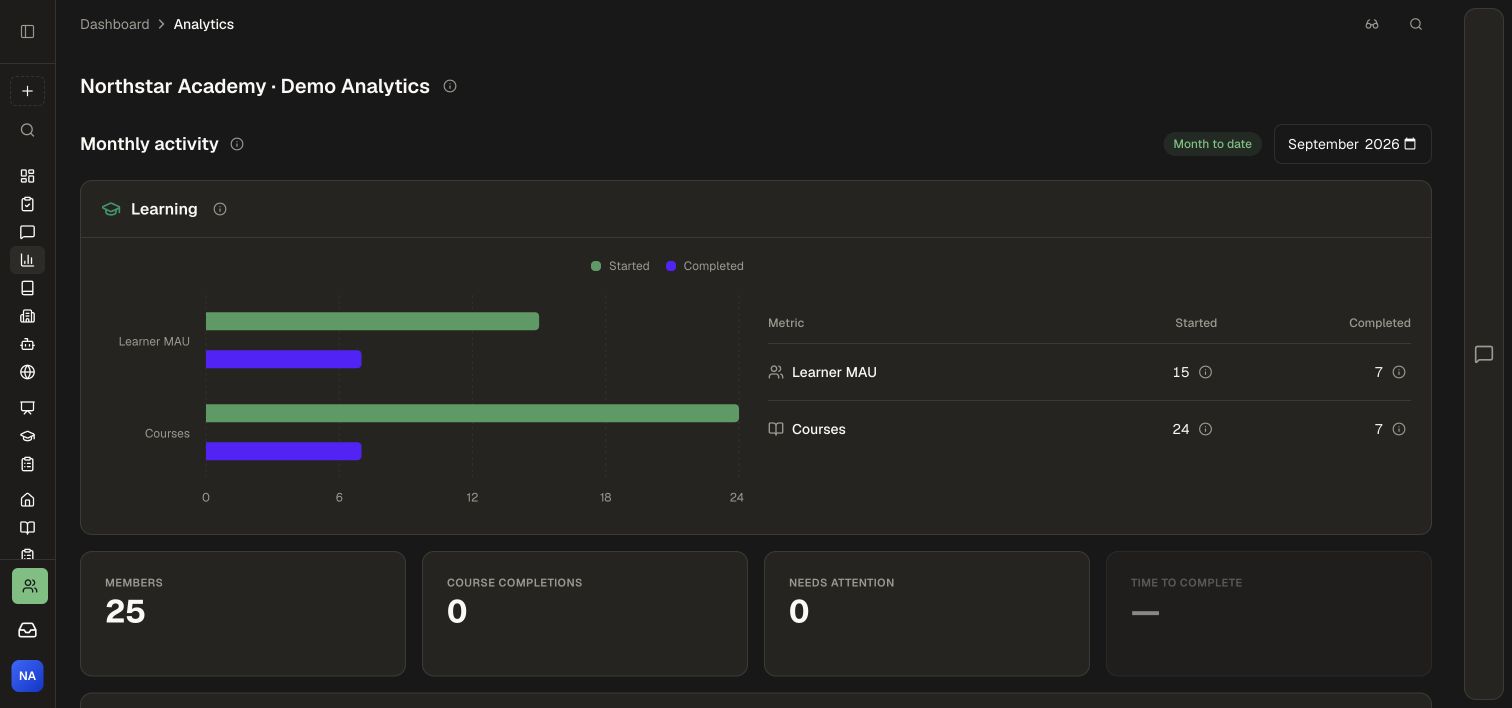
A month-to-date result covers the current month so far. Compare course counts with course counts and unique learner counts with unique learner counts.
2. Narrow the investigation
- Review Members, Course completions, Needs attention, and Time to complete.
- Use the Groups table to compare cohorts.
- In Courses, choose Most completed, Least completed, Highest score, Lowest score, Most enrolled, or Least enrolled.
- Review Member-initiated learning separately from assigned course performance.
- In Learning modes, switch between Time used and People used.
To focus on a single cohort, open My groups, choose the group, and select Analytics. Its member table offers search, membership, sort, and score filters. Course completion should be interpreted alongside the content and completion rules assigned to that cohort.
3. Ask an analytics question
Open the Workspace Assistant from the page and describe the scope and period you need. For example: “Summarize monthly learning activity for this workspace and explain what each metric counts.” Review the sources and the returned scope before using the result.
Use the analytics question library for ready-to-adapt questions covering progress, assignments, assessment answers, learning modes, projects, and retention. Name the intended cohort so the answer stays useful to the people managing that program.
4. Review creation activity
Find Course creation on the analytics page. Review monthly active creators and the Started and First published counts for Courses, Assessments, and Atoms. Opening or editing an existing course is different from a first publication.
5. Build a saved custom report
Keep the answers you use regularly on your dashboard. A custom report turns a plain-language question into a saved widget that can refresh as learning activity changes.
- Return to Dashboard and find Custom Reports.
- Choose Add widget to open Add a custom report.
- Describe the audience, metrics, and presentation you want. For example: “Create Northstar learning activity. Show total members and a table of courses with enrolled learners, completed learners, and completion rate. Explain what each metric counts.”
- Choose Build it. Review the generated widget and its metric definitions. The created widget is saved to the dashboard.
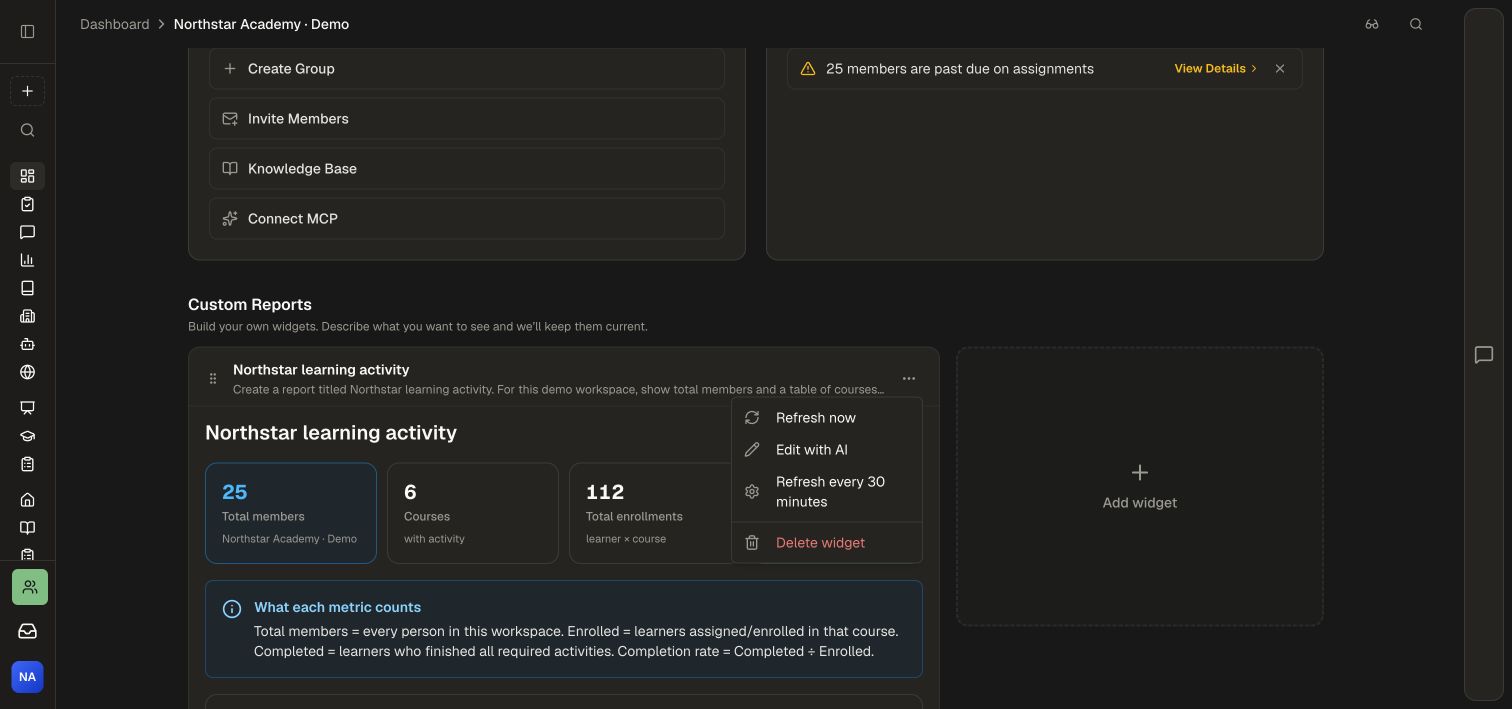
- Open the widget’s options menu. Choose Refresh now to update the report, or Edit with AI to refine the question or presentation.
- Review its refresh cadence. The example offers Refresh every 30 minutes; use the menu to manage the report’s update schedule.
- Return to the dashboard to use the saved report alongside the standard course and member tables.
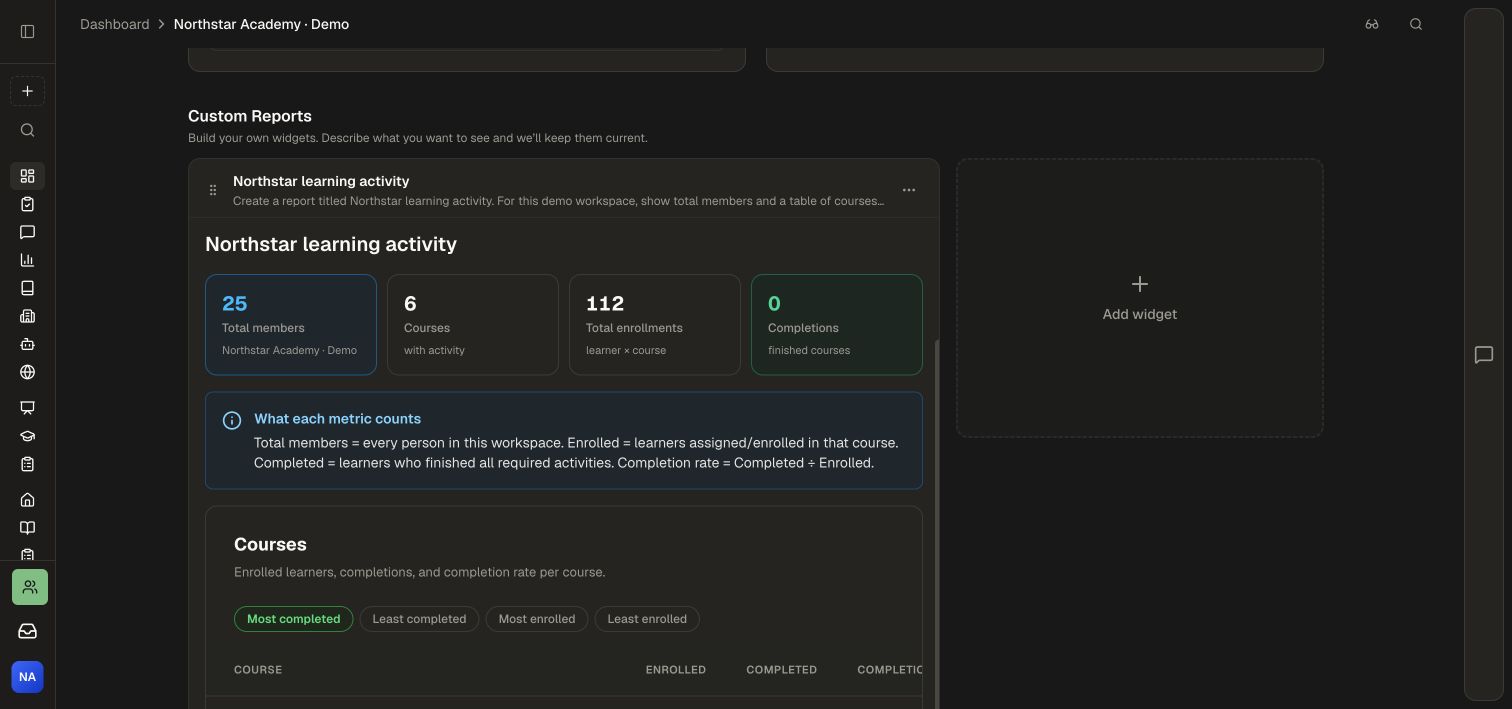
The example shows 25 members, 6 courses with activity, 112 enrollments, and 0 completions. Enrollments count learner–course relationships, so one person can contribute more than one enrollment.
6. Turn results into a next step
Compare Needs attention with the cohort’s assignment requirements. Ask the Workspace Assistant to focus on a course, group, or learner: “For this onboarding course, show the units and topics learners are struggling with, then summarize quiz and test performance.” Review the relevant activity or project submission before deciding whether learners need more practice, a clearer explanation, or a revised source.
For leadership or program reporting, specify the cohort and period in the report request. To combine learning records with approved business data, follow Connect learning and business outcomes.
Tips for a smooth setup
- Compare loaded results: let the report finish loading, then use its current values for your comparison.
- Use the cohort’s completion criteria: inspect its assignment requirements when interpreting completion.
- Give reviewers the right access: use a role with analytics access at the intended workspace or group scope.
For intake, employment, and government-format evidence, use Funder and Compliance Reporting.
For the completion requirements behind a cohort's results, inspect its assignments and curricula.